Walnut Creek Housing Market Data
Average Sale Price: $931K (-$177,970)
Total Listings: 104 (-60.0%)
New on Market: 32 (-62.4%)
Avg. Sale Price / Sq.Ft.: $572 (-57)
Avg. Sale Price as % of Asking: 99% (+1%)
Days on Market: 40 (+6)
1. Data as of Jan, 05 2026. Remaining statistics above are calculated on activity within the period from Dec, 05 2025 to Jan, 05 2026. Increase/Decrease activity is compared to the month of November.
Subscribe to Market Reports
Neighborhoods: Adams Point, Alameda, Albany, Albany Hill, Berkeley, Berkeley Hills, Castro Valley, Claremont, Uplands, Concord, Crocker Highlands, Trestle Glen, Crockett, Dimond, Dogtown, Downtown Oakland, Uptown, Old Oakland, Chinatown, El Cerrito, El Sobrante, Elmwood, Emeryville, Estudillo Estates, Glenview, Gourmet Ghetto, North Campus, Grand Lake, Hayward, Hercules, Jack London Square, Kensington, Lafayette, Lake Merritt, Lakeside, Lorin, South Berkeley, Marina Bay, Martinez, Maxwell Park, Memorial Park, Mira Vista, Montclair, NOBE, Northbrae, Oakland, Oakmore, Ocean View, Fourth Street, Panoramic Hill, Piedmont, Piedmont Avenue, Piedmont Pines, Pinole, Pleasant Hill, Point Richmond, Redwood Heights, Richmond, Richmond Annex, Richmond North & East, Rockridge (Lower), Rockridge (Upper), Rodeo, San Leandro, San Lorenzo, Sheffield Village, St. Jerome's, Temescal, The Laurel, Thousand Oaks, Walnut Creek, West Berkeley, West Oakland, Westbrae
Property Type: Commercial, Lot & Land, Multi-Unit, Single Family Home, Condo / Townhouse
Bedrooms: Studio, 1, 2, 3, 4, 5+
Average Sale Price

Date — Avg Price
01/25 — $1,050,570
02/25 — $851,702
03/25 — $924,443
04/25 — $1,062,200
05/25 — $1,083,330
06/25 — $1,033,170
07/25 — $1,052,120
08/25 — $1,114,900
09/25 — $974,572
10/25 — $964,213
11/25 — $1,109,040
12/25 — $935,198
Average Days on Market
Date — Avg Days
01/25 — 32
02/25 — 31
03/25 — 34
04/25 — 25
05/25 — 24
06/25 — 30
07/25 — 28
08/25 — 30
09/25 — 32
10/25 — 32
11/25 — 34
12/25 — 39
Listed Properties
Date — Listings
01/25 — 119
02/25 — 93
03/25 — 130
04/25 — 127
05/25 — 136
06/25 — 108
07/25 — 116
08/25 — 119
09/25 — 131
10/25 — 138
11/25 — 85
12/25 — 41
Average % List Over Sold Price
Date — Avg Sale/List Price
01/25 — 100.70%
02/25 — 100.59%
03/25 — 99.84%
04/25 — 100.50%
05/25 — 100.82%
06/25 — 100.52%
07/25 — 99.72%
08/25 — 99.15%
09/25 — 99.74%
10/25 — 99.98%
11/25 — 98.28%
12/25 — 99.62%
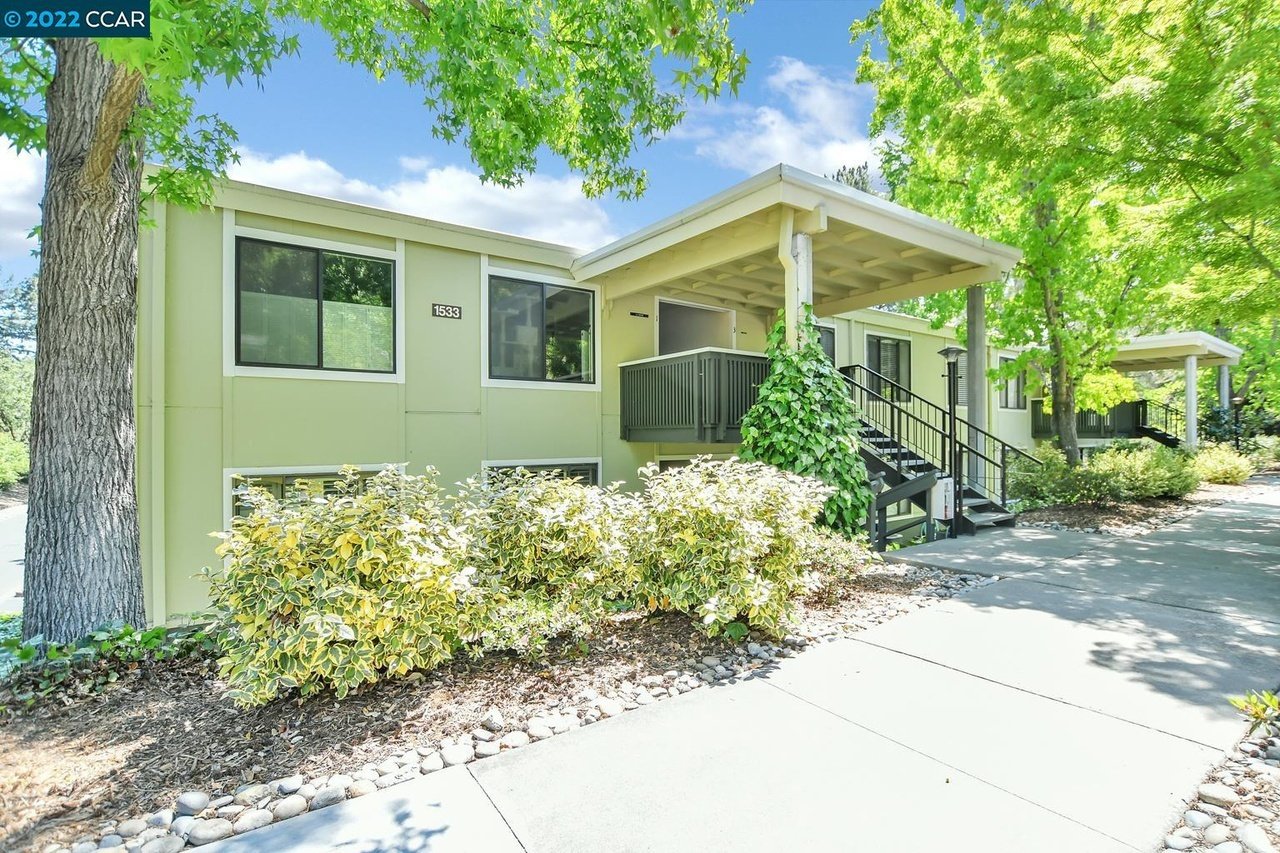
Recently Sold Homes in Walnut Creek

1533 Oakmore Dr, #2, Walnut Creek, CA 94595
2 Bed, 1 Full Bath
Sold Price: $445,000
Closed
Data reflected in these reports is pulled from: MAXEBRDI, LogicMLS


