El Cerrito Housing Market Data
- Average Sale Price: $1.13M (+$104,820)
- Total Listings: 11 (−63.3%)
- New on Market: 3 (−57.1%)
- Avg. Sale Price/Sq.Ft.: $760 (+4)
- Avg. Sale Price as % of Asking: 108% (−4%)
- Days on Market: 30 (+12)
Data as of Jan, 05 2026. Remaining statistics above are calculated on activity within the period from Dec, 05 2025 to Jan, 05 2026. Increase/Decrease activity is compared to the month of November.
Neighborhoods
Adams Point, Alameda, Albany, Albany Hill, Berkeley, Berkeley Hills, Castro Valley, Claremont, Uplands, Concord, Crocker Highlands, Trestle Glen, Crockett, Dimond, Dogtown, Downtown Oakland, Uptown, Old Oakland, Chinatown, El Cerrito, El Sobrante, Elmwood, Emeryville, Estudillo Estates, Glenview, Gourmet Ghetto, North Campus, Grand Lake, Hayward, Hercules, Jack London Square, Kensington, Lafayette, Lake Merritt, Lakeside, Lorin, South Berkeley, Marina Bay, Martinez, Maxwell Park, Memorial Park, Mira Vista, Montclair, NOBE, Northbrae, Oakland, Oakmore, Ocean View, Fourth Street, Panoramic Hill, Piedmont, Piedmont Avenue, Piedmont Pines, Pinole, Pleasant Hill, Point Richmond, Redwood Heights, Richmond, Richmond Annex, Richmond North & East, Rockridge (Lower), Rockridge (Upper), Rodeo, San Leandro, San Lorenzo, Sheffield Village, St. Jerome's, Temescal, The Laurel, Thousand Oaks, Walnut Creek, West Berkeley, West Oakland, Westbrae
Average Sale Price (Monthly)
| Date | Avg Price |
|---|---|
| 01/25 | $1,169,120 |
| 02/25 | $1,236,340 |
| 03/25 | $1,050,020 |
| 04/25 | $1,244,280 |
| 05/25 | $1,230,250 |
| 06/25 | $1,410,650 |
| 07/25 | $1,528,280 |
| 08/25 | $1,467,380 |
| 09/25 | $1,180,860 |
| 10/25 | $1,241,220 |
| 11/25 | $1,025,410 |
| 12/25 | $1,134,000 |
Average Days on Market
| Date | Avg Days |
|---|---|
| 01/25 | 14 |
| 02/25 | 38 |
| 03/25 | 15 |
| 04/25 | 15 |
| 05/25 | 19 |
| 06/25 | 21 |
| 07/25 | 21 |
| 08/25 | 16 |
| 09/25 | 20 |
| 10/25 | 19 |
| 11/25 | 18 |
| 12/25 | 26 |
Listed Properties
| Date | Listings |
|---|---|
| 01/25 | 14 |
| 02/25 | 20 |
| 03/25 | 15 |
| 04/25 | 21 |
| 05/25 | 19 |
| 06/25 | 10 |
| 07/25 | 6 |
| 08/25 | 16 |
| 09/25 | 22 |
| 10/25 | 31 |
| 11/25 | 7 |
| 12/25 | 8 |
Average % List Over Sold Price
| Date | Avg Sale/List Price |
|---|---|
| 01/25 | 131.00% |
| 02/25 | 117.29% |
| 03/25 | 116.33% |
| 04/25 | 130.85% |
| 05/25 | 122.80% |
| 06/25 | 126.34% |
| 07/25 | 118.79% |
| 08/25 | 124.75% |
| 09/25 | 127.82% |
| 10/25 | 115.11% |
| 11/25 | 112.24% |
| 12/25 | 111.71% |
Recently Sold Homes in El Cerrito

521 Vista Heights, El Cerrito, CA 94530
3 Bed, 3 Full Baths
Sold Price: $738,000

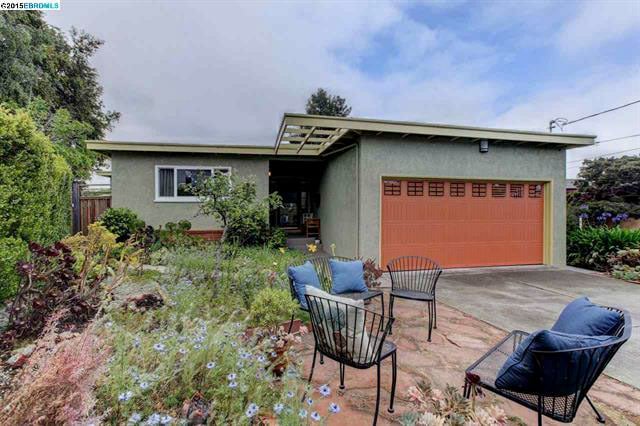
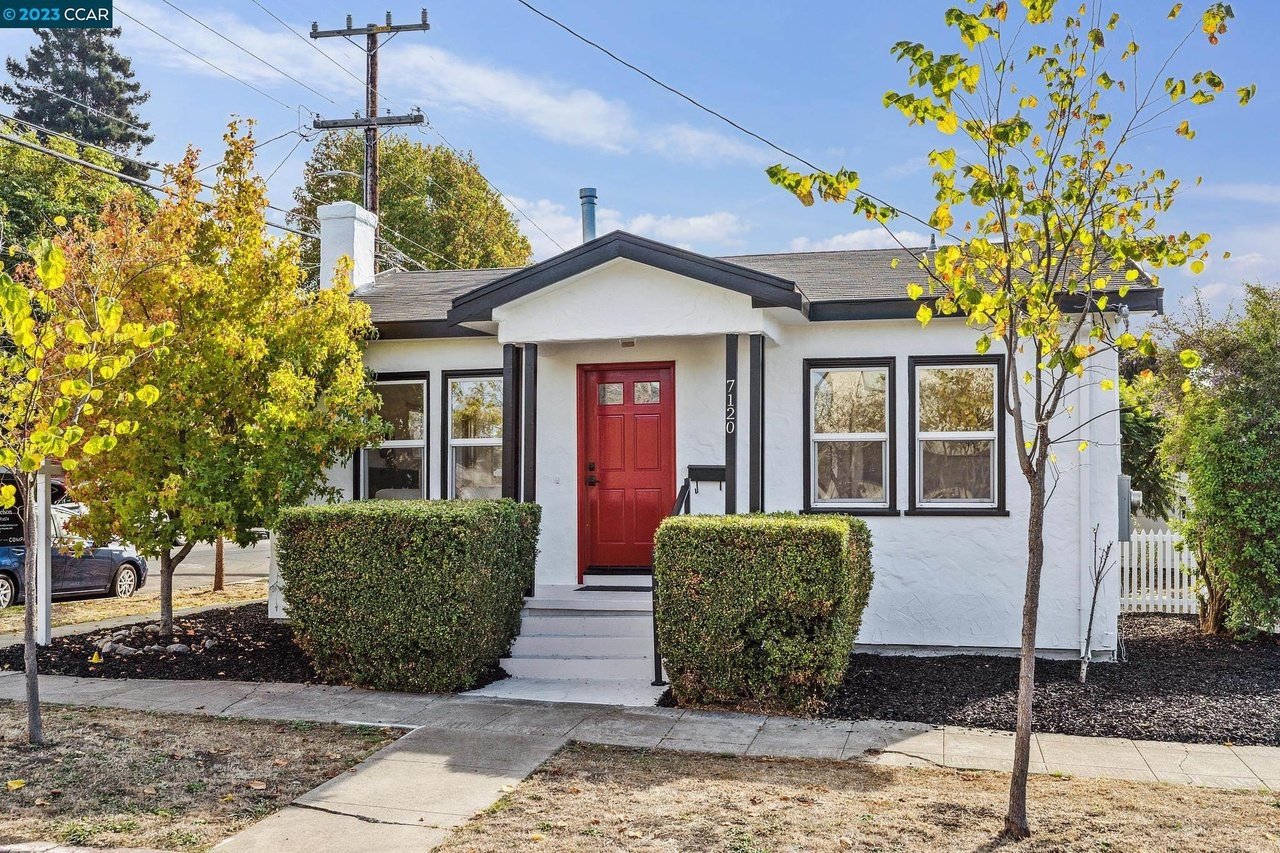
7120 Central Ave, El Cerrito, CA 94530
2 Bed, 1 Full Bath
Sold Price: $850,000

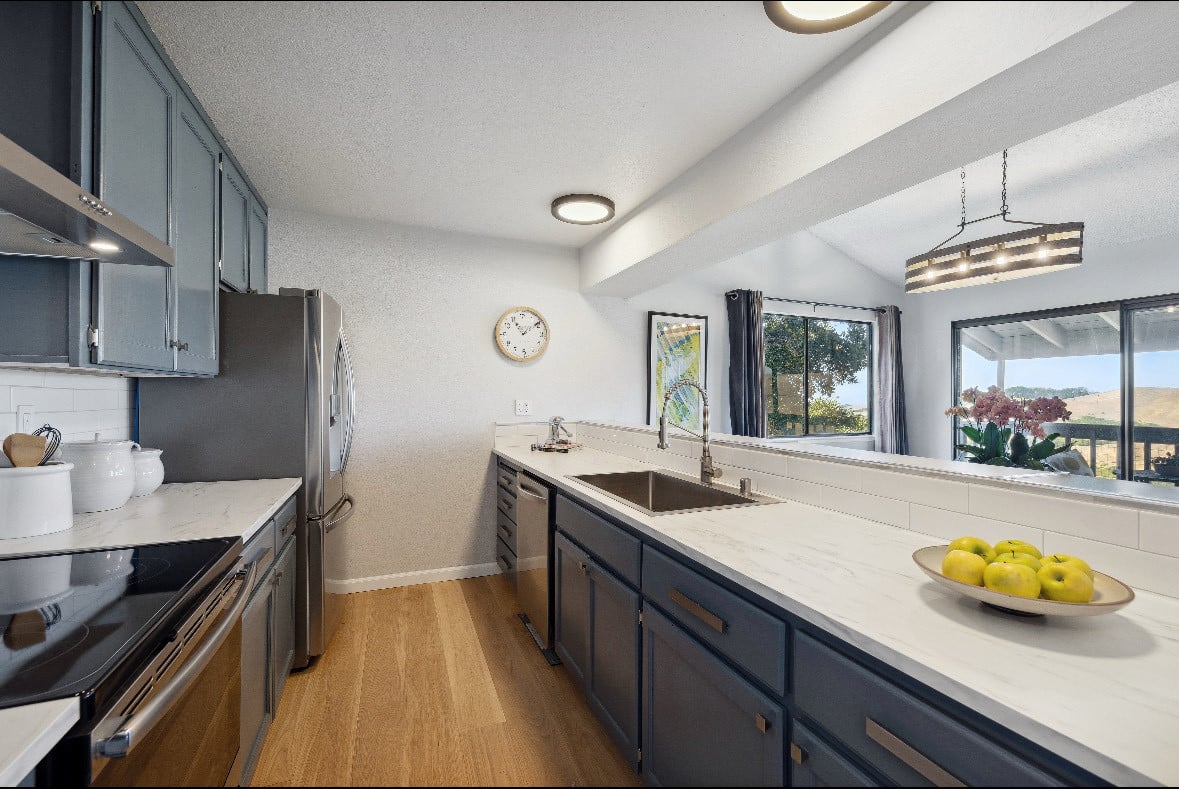
7600 Potrero Avenue, El Cerrito, CA 94530
3 Bed, 2 Full Baths
Sold Price: $1,328,000

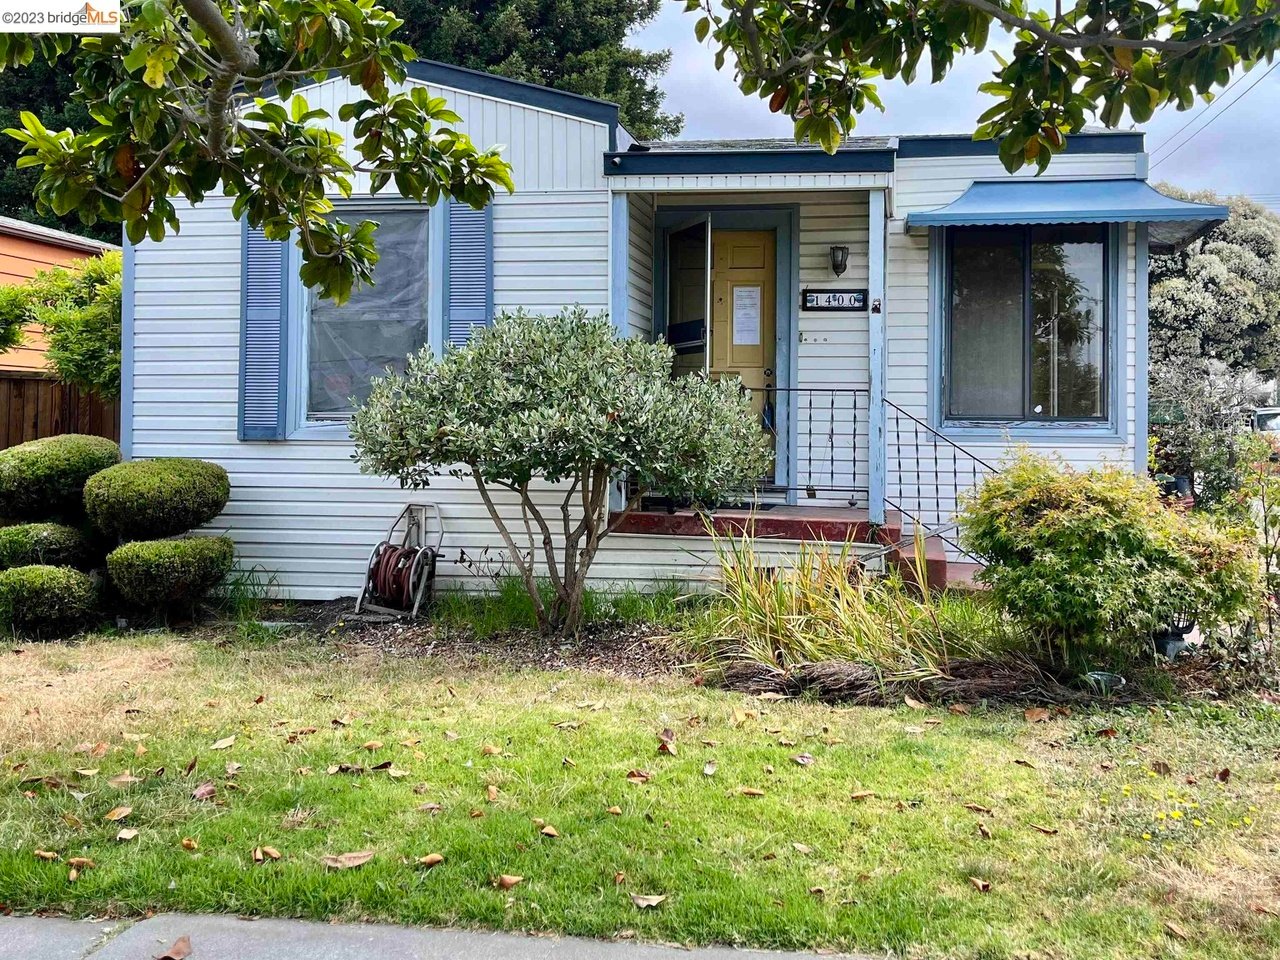
1400 Liberty St, El Cerrito, CA 94530
2 Bed, 1 Full Bath
Sold Price: $580,000

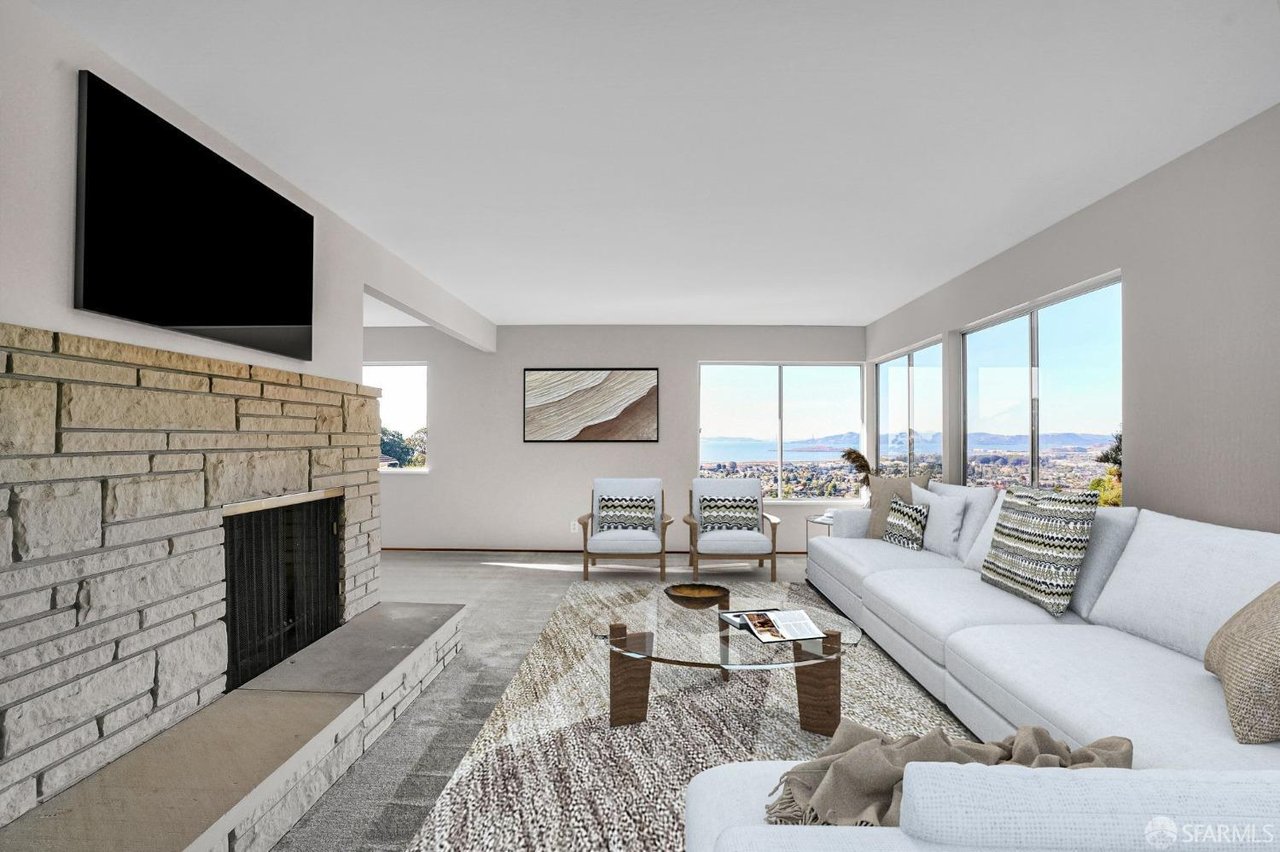
7124 Mound Street, El Cerrito, CA 94530
3 Bed, 2 Full Baths, 1,314 Sq. Ft.
Sold Price: $1,325,000
© 2026 Red Oak Realty | Team510 | Chimène Pollard
Information was last updated on January 05, 2026 10:39 AM - PT
Data reflected in these reports is pulled from: MAXEBRDI, LogicMLS